Consultation coordinates
Can we predict which consultations have geographic coordinates?
Jacob Malcom
2016-06-15
Introduction
The U.S. Fish and Wildlife Service (FWS) tracks metadata about section 7 consultations1 in their TAILS database. One set of variables in TAILS is available for recording the geographic coordinates of the actions evaluated during consultation. We have previously analyzed TAILS data from 2008 - early 20152, and one finding was that only ~50% of consultations have coordinates recorded. Cursory examination of the pattern suggested that coordinate presence / absence was not a random sample from among all 88,290 consultations. Consider this (weird) plot of consultations with (top blocks) and without (bottom blocks) coordinates across FWS regions:
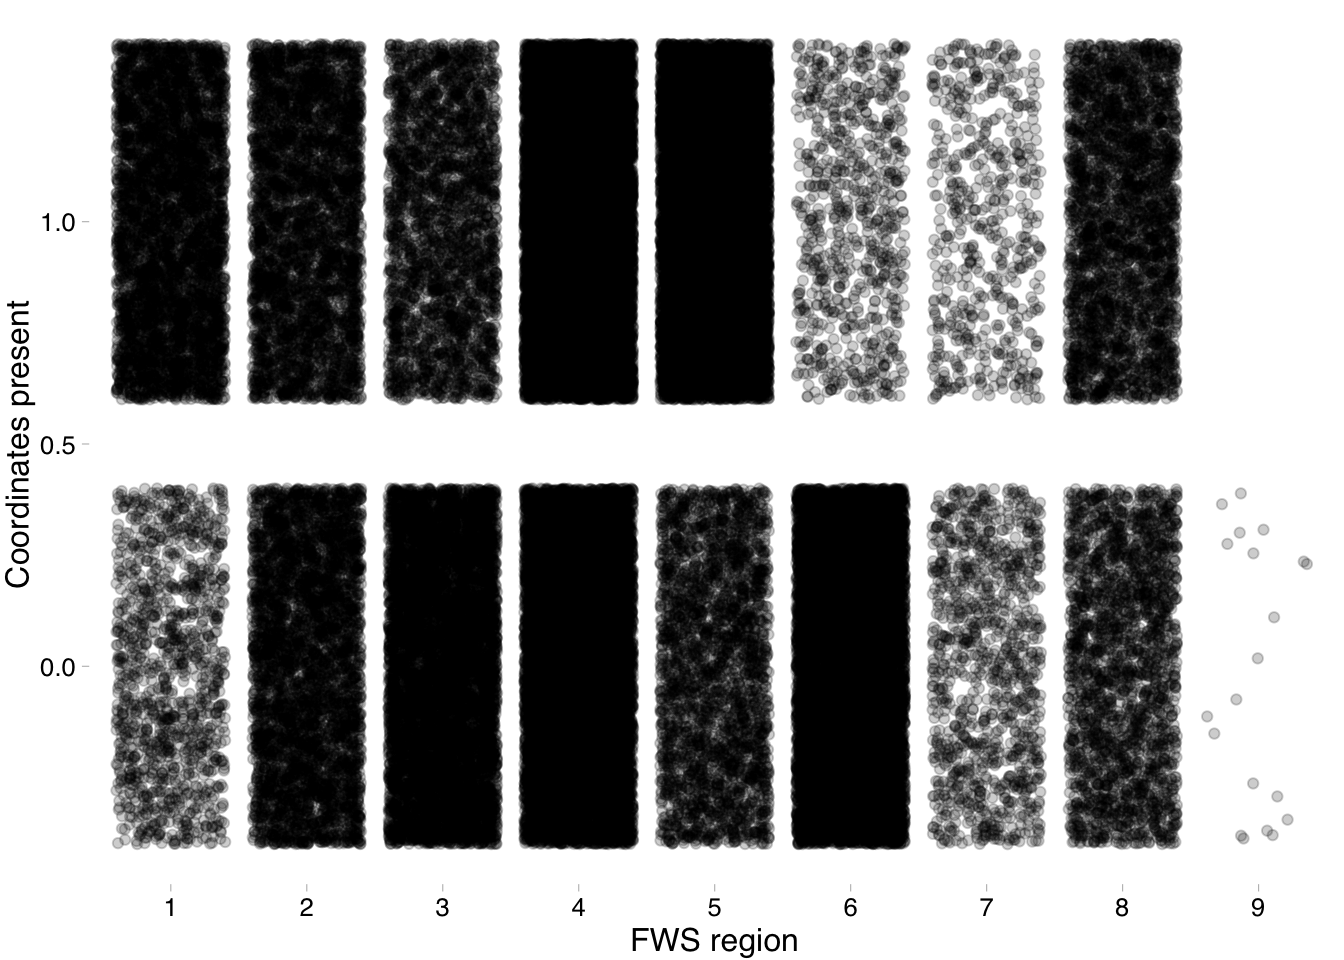
Figure 1. Whether a consultation has coordinates (top boxes) or not (bottom) varies significantly by FWS region.
In this working document3 we test the hypothesis that the consultations with coordinates are not a random sample of all consultations. If supported, we expect that whether consultations have coordinates can be predicted by considering the characteristics of each consultation. We show that the FWS Ecological Services (ES) office in which a consultation was completed and whether a consultation was formal are both predictive. We expect the results may be useful for correcting for biases in coordinate data entry when making inferences in other analyses.
Models
The response variable, whether or not a consultation has coordinates, is binary; a binomial generalized linear model is therefore appropriate. We first consider a global model that includes four predictor variables from TAILS4:
# mod1 <- glm(coords ~ region + ESOffice + formal_consult + work_category,
#           data = full,
#           family = "binomial")
There is a problem with this model: every ES office is nested within an FWS region. After removing region, we first find:
mod2 <- glm(coords ~ ESOffice + formal_consult + work_category, data = full, family = "binomial")
amod2 <- anova(mod2, test="Chisq")
amod2
## Analysis of Deviance Table
##
## Model: binomial, link: logit
##
## Response: coords
##
## Terms added sequentially (first to last)
##
##
## Df Deviance Resid. Df Resid. Dev Pr(>Chi)
## NULL 88289 122283
## ESOffice 77 49939 88212 72344 < 2.2e-16 ***
## formal_consult 1 181 88211 72163 < 2.2e-16 ***
## work_category 91 2145 88120 70018 < 2.2e-16 ***
## ---
## Signif. codes: 0 '***' 0.001 '**' 0.01 '*' 0.05 '.' 0.1 ' ' 1Work category has a reasonably large deviance, but with 91 df the average contribution is small (~13% of the formal consultation effect). There’s a chance that different ES offices have different guidance about what data gets recorded for formal vs. informal consultations. If so, then we should find a statistically significant interaction term:
mod3 <- glm(coords ~ ESOffice * formal_consult, data = full, family = "binomial")
amod3 <- anova(mod3, test="Chisq")
amod3
## Analysis of Deviance Table
##
## Model: binomial, link: logit
##
## Response: coords
##
## Terms added sequentially (first to last)
##
##
## Df Deviance Resid. Df Resid. Dev Pr(>Chi)
## NULL 88289 122283
## ESOffice 77 49939 88212 72344 < 2.2e-16 ***
## formal_consult 1 181 88211 72163 < 2.2e-16 ***
## ESOffice:formal_consult 68 257 88143 71906 < 2.2e-16 ***
## ---
## Signif. codes: 0 '***' 0.001 '**' 0.01 '*' 0.05 '.' 0.1 ' ' 1And we do see a significant interaction. The parameter estimates of 63 of the 78 ES offices were significantly different from zero at alpha = 0.05. We can’t really get “percent variance explained” with a binomial GLM, but the residual deviance is ~60% of the null deviance, pointing to ~40% of variation explained by ES office, whether a consultation is formal, and an interaction of the two.
Graphs
Coordinate data by ES office
The preceding analyses are informative, but graphical representation of the data is often warranted. First, because ES Office plays such a large role, we consider which offices have high vs. low rates of recording the coordinates. In addition, because workload might explain the variation in percentage of consultations with coordinates (i.e., more consultations, less time to record complete data in TAILS), we also plot the number of consultations:
A quick glance of this plot illustrates that some of the least- and most-consulting offices rank in the top-10 of percentage of consultations with recorded coordinates. If workload is driving the coordinate recording, then we expect to see a strong negative correlation…but we don’t:
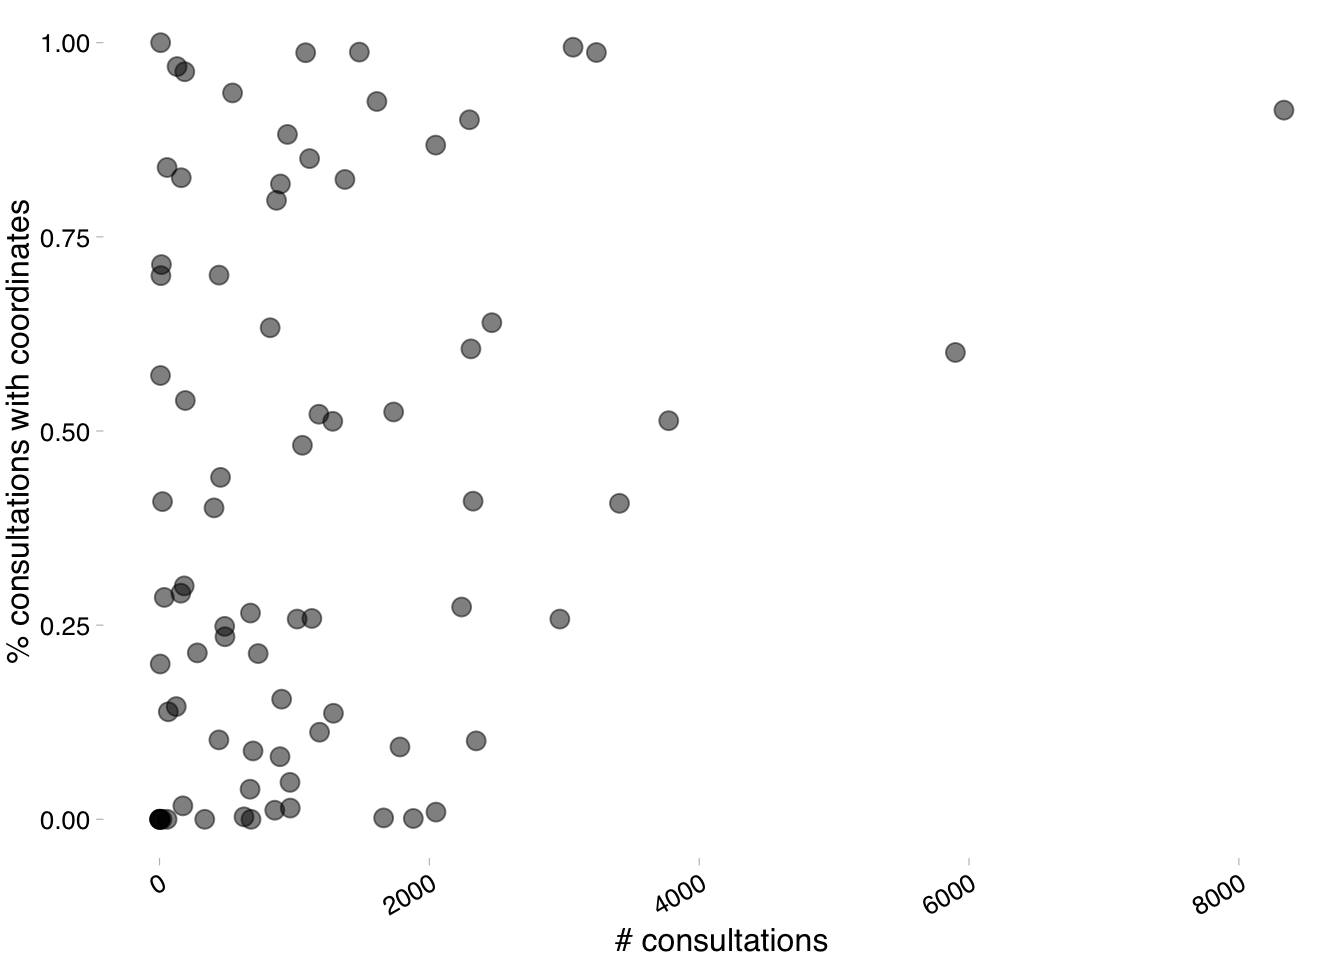
Figure 3. There’s no strong pattern relating total number of consultations to the rate at which data is recorded.
Coordinate data for formal consultations
Whether a consultation is formal had a small effect (~5%: informal = 52.2% with coordinates, formal = 46.7%). We can see how small that is in graphical form:
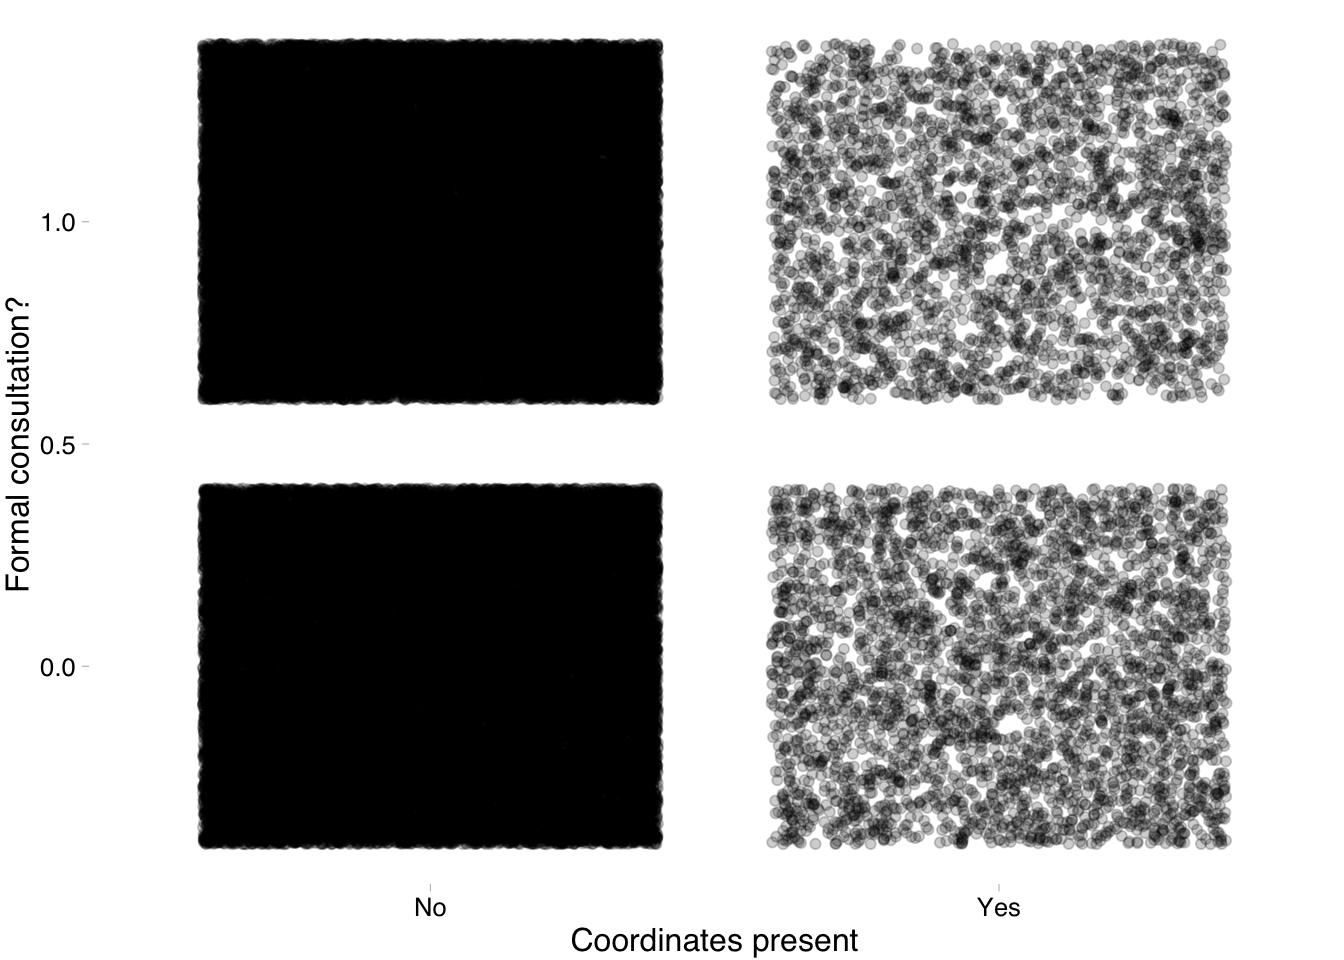
Figure 4. The effect of a consultation being formal is small and barely visible. Statistically significant, but not significant overall.
Conclusion
This brief analysis demonstrates that FWS personnel have not consistently or randomly recorded the coordinates of section 7 consultations. Simply knowing the office where a consultation was done can take you surprisingly far in predicting the likelihood that there are coordinates recorded. We expected that formal consultations might have stronger predictive power: we need to know the locations of actions that adversely affect ESA-listed species to monitor the actions. But formal / informal consultation only accounted for ~5% of variation, and formal consultations were generally less likely to have coordinates. Last, we think these results will be useful in correcting for the biases in the coordinate data that has been collected. For example, a simple extension of this analysis could be making a choropleth map showing the deviation of the percentage of consultations with coordinates from the mean rate (51.8%).
Version 0.2
Updated 16 May 2016 to use highcharter for Figure 2.
This working “paper” is not the final word on the analysis of section 7 coordinates…it’s subject to revision.

This work by Defenders of Wildlife is licensed under a Creative Commons Attribution 4.0 International License.
See FWS’s Midwest Region page for an overview of the consultation process.↩
Written with R markdown, but converted to HTML because several calculations are computationally expensive.↩
coords = coordinates present / absent; region = FWS region of consultation; formal_consult = whether consultation was formal; work_category = high-level categorization of action being consulted on↩