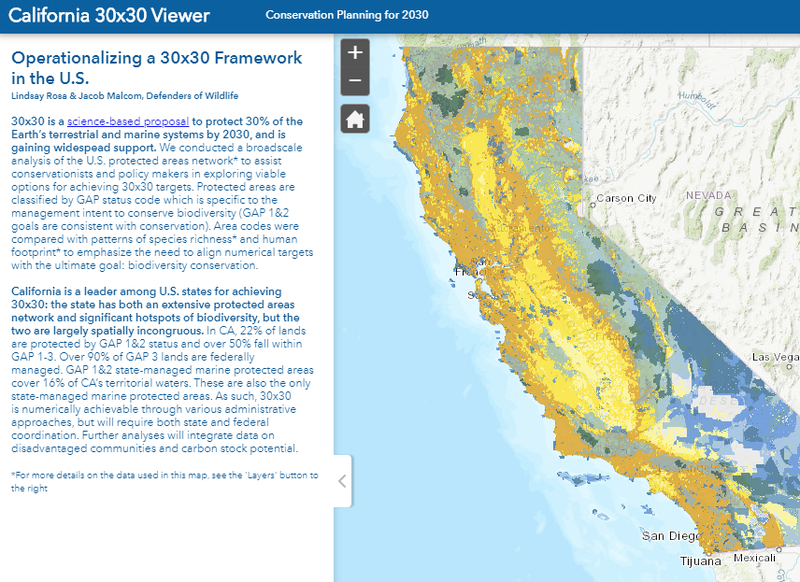
This interactive web map facilitates a spatial comparison between California’s protected areas network, biodiversity, human disturbance, carbon stocks, and disadvantaged communities for consideration in achieving targets to protect 30% of the state’s land and waters by 2030 (in support of AB-3030). In siting future areas for protection, additional guidance is needed to operationalize the 30x30 framework in a way that 1) effectively connects its premise with current and potential laws and policies and 2) maximizes benefits to biodiversity conservation.
As the previous VP of the Center for Conservation Innovation at Defenders, Lindsay led the Center for Conservation Innovation’s science, technology, and policy teams.